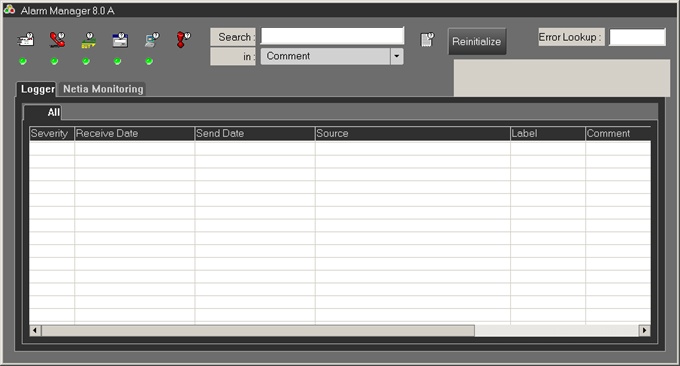
The AlarmManager software is divided into two parts:
• The upper section is used to configure AlarmManager and to query alarms.


When the various configuration parameters have been activated, the status of the button changes from red to green.
Search : this field makes it possible to carry out searches on the alarms received by AlarmManager in relation to the criterion selected in the combo-box "In".
Criteria : ![]() This button is used to define the type of messages to be displayed in the message list.
This button is used to define the type of messages to be displayed in the message list.
Reinnitialize : This button refreshes the display of the list in relation to the information already checked and resets the relays of the GPI card.
Error Lookup : This field allows you to search into the list of messages.
• The lower part displays in the "Logger" tab the list of alarms received by AlarmManager via the logger service.
This tab displays all the alarms in the "All" tab, it is also possible to display the alarms by machine.

Description of the columns of the "All" tab:
Severity : Displays the severity level of messages.
Receive Date : Displays the date when the Logger Service received the message.
Send Date : Displays the date when the source sent the message.
Source : Displays the name of the computer that is causing the message.
Label : Displays the name of the application that is causing the message.
Comment : Displays a comment on the message based on its severity level.